Landing Page
Analytics
Once logged in, the user will be able to view the dashboard page of the admin application. The dashboard page comprises metrics and statistics of the Medpeople project, such as:
- Total booked shifts (Monthly)
- Monthly active users (MAU Consultants)
- Monthly active employers (MAU Employers)
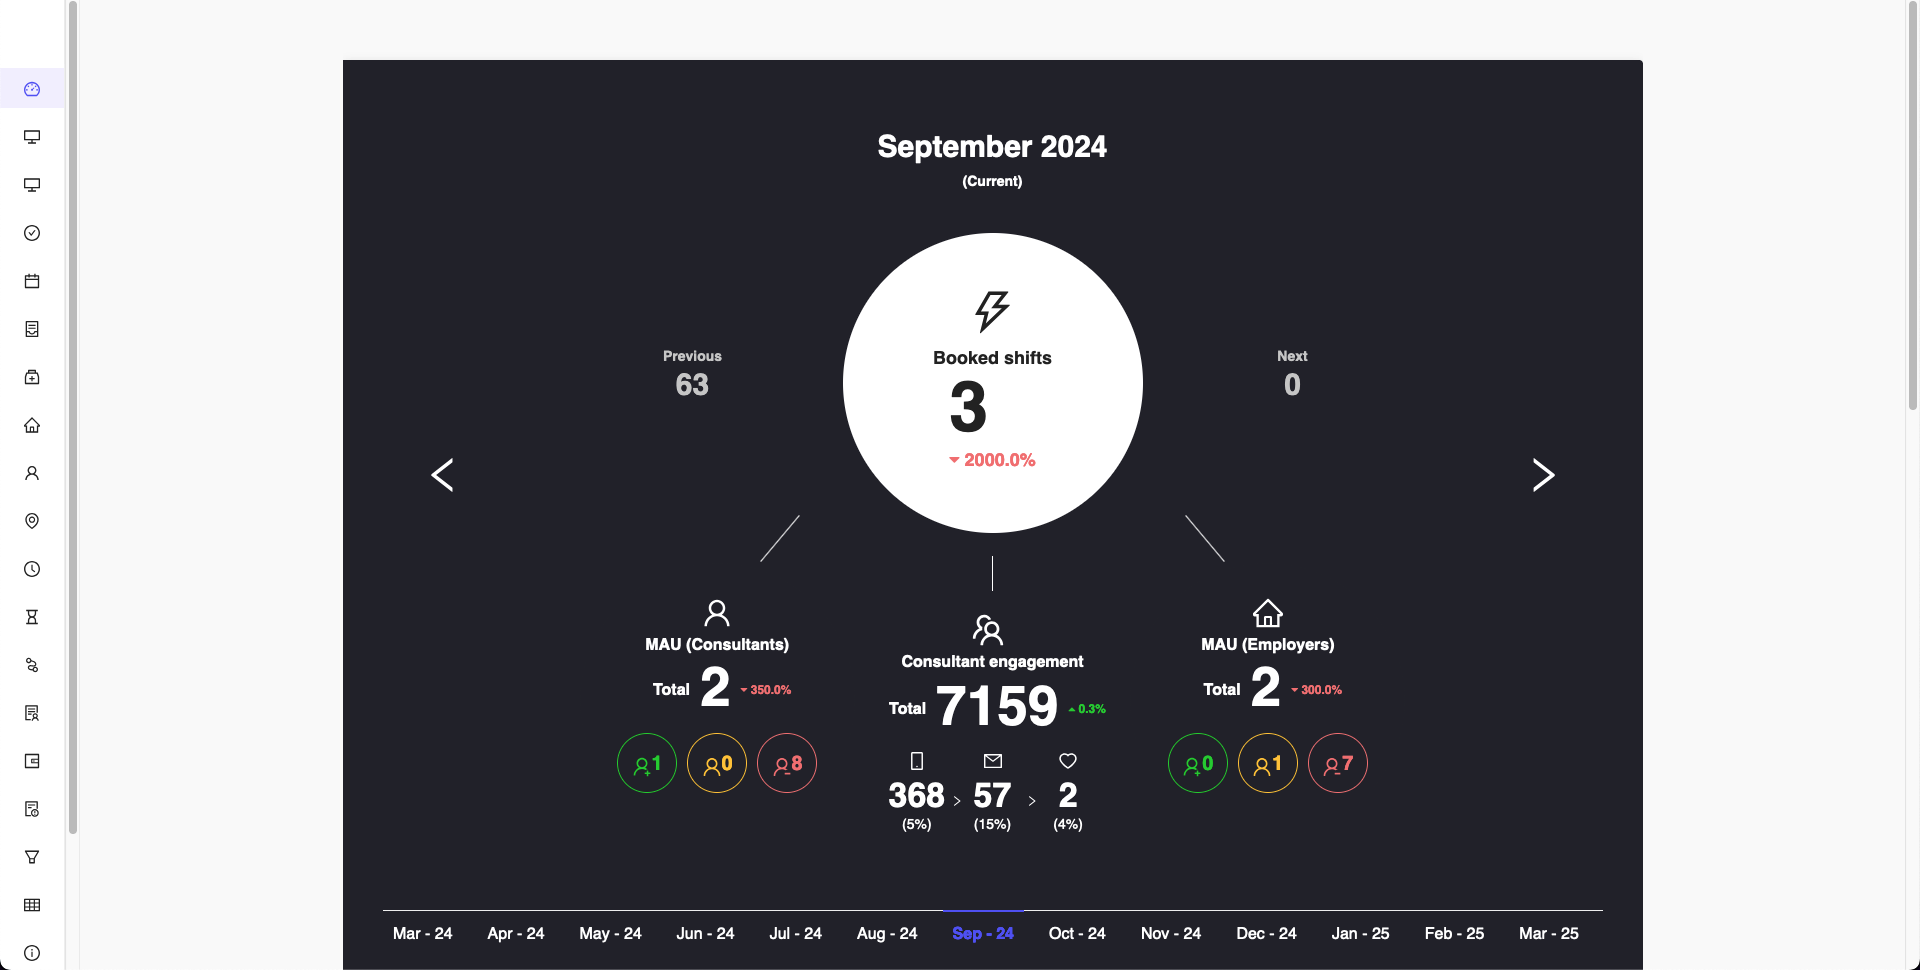 Figure 2: Admin Dashboard Page Analytics
Admin users are able to view past month's statistics using the arror button provided on each side of the analytics card, or by selecting the month from the bottom.
Events
The dashboard page also displays booking events with time, shift publications etc. by various Consultants and Employers on a daily basis. Historical events can be viewed in the same dashboard page as well, which can be helpful for the Admin users to keep track of the events.
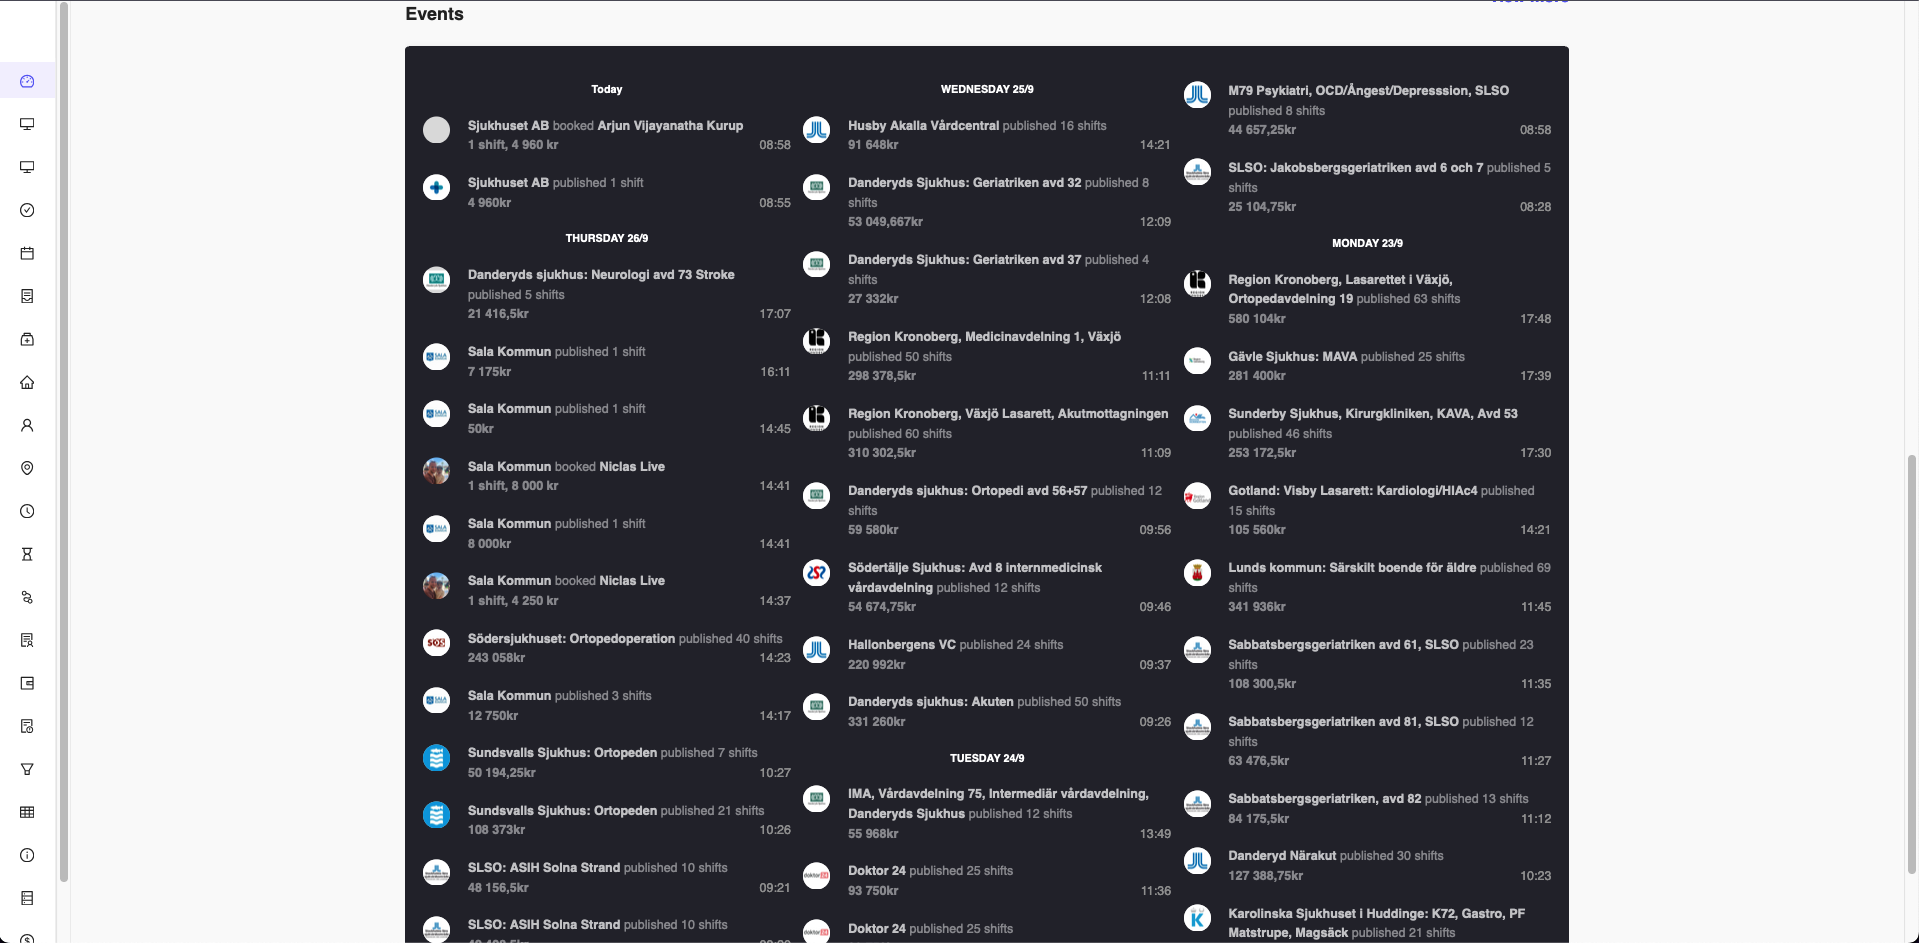 Figure 2: Admin Dashboard Page Events